미국 신생아 이름 분석
신생아 출생 트렌드, 이름 유행 분석, 첫글자 및 마지막 글자의 변화 추세
3. Baby Names (2000 - 2010)
- 출처 : “파이썬 라이브러리를 활용한 데이터분석 (웨스 맥키니)”
import numpy as np
import pandas as pd
import matplotlib.pyplot as plt
%matplotlib inline
names2010 = pd.read_csv('data/names/yob2010.txt', names=['name', 'sex', 'births'])
names2010.head()
| name | sex | births | |
|---|---|---|---|
| 0 | Isabella | F | 22731 |
| 1 | Sophia | F | 20477 |
| 2 | Emma | F | 17179 |
| 3 | Olivia | F | 16860 |
| 4 | Ava | F | 15300 |
names2010.shape
(33838, 3)
names2010.groupby('sex').births.sum()
sex
F    1759010
M    1898382
Name: births, dtype: int64
년도별 데이터 합치기
years = range(1880, 2011)
pieces = []
columns = ['name', 'sex', 'births']
for year in years:
    path = 'data/names/yob%d.txt' % year
    df = pd.read_csv(path, names=columns)

    df['year'] = year
    pieces.append(df)
# 하나의 dataframe으로 취합.
names = pd.concat(pieces, ignore_index=True)  # ignore_index : 원래의 행순서 상관없음.
names.head()
| name | sex | births | year | |
|---|---|---|---|---|
| 0 | Mary | F | 7065 | 1880 |
| 1 | Anna | F | 2604 | 1880 |
| 2 | Emma | F | 2003 | 1880 |
| 3 | Elizabeth | F | 1939 | 1880 |
| 4 | Minnie | F | 1746 | 1880 |
names.tail()
| name | sex | births | year | |
|---|---|---|---|---|
| 1690779 | Zymaire | M | 5 | 2010 |
| 1690780 | Zyonne | M | 5 | 2010 |
| 1690781 | Zyquarius | M | 5 | 2010 |
| 1690782 | Zyran | M | 5 | 2010 |
| 1690783 | Zzyzx | M | 5 | 2010 |
total = names.groupby(['year', 'sex']).births.sum()
total.head(10)
year  sex
1880  F       90993
      M      110493
1881  F       91955
      M      100748
1882  F      107851
      M      113687
1883  F      112322
      M      104632
1884  F      129021
      M      114445
Name: births, dtype: int64
total_births = names.pivot_table('births', index='year', columns='sex', aggfunc=sum)
total_births.head()
| sex | F | M |
|---|---|---|
| year | ||
| 1880 | 90993 | 110493 |
| 1881 | 91955 | 100748 |
| 1882 | 107851 | 113687 |
| 1883 | 112322 | 104632 |
| 1884 | 129021 | 114445 |
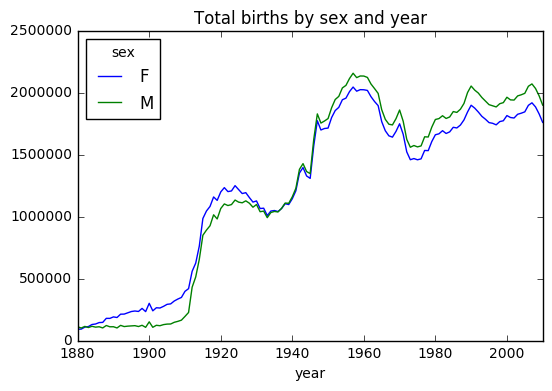
성별, 연도별 출생 트렌드
plt.figure()
total_births.plot(title='Total births by sex and year')
<matplotlib.axes._subplots.AxesSubplot at 0x11dc4df28>


<matplotlib.figure.Figure at 0x104b48cf8>
# 년도별 성별 그룹핑
ysGrouped = names.groupby(['year', 'sex'])

g = []
for name, group in ysGrouped:
    g.append(name)

print(g[:10])
[(1880, 'F'), (1880, 'M'), (1881, 'F'), (1881, 'M'), (1882, 'F'), (1882, 'M'), (1883, 'F'), (1883, 'M'), (1884, 'F'), (1884, 'M')]
ysGrouped.get_group((2000,'F')).head() # 특정 그룹에 속한 데이터
| name | sex | births | year | |
|---|---|---|---|---|
| 1332172 | Emily | F | 25949 | 2000 |
| 1332173 | Hannah | F | 23066 | 2000 |
| 1332174 | Madison | F | 19965 | 2000 |
| 1332175 | Ashley | F | 17991 | 2000 |
| 1332176 | Sarah | F | 17677 | 2000 |
# 각 이름이 각 그룹에서 차지하는 비율
def add_prop(group):
    births = group.births.astype(float)
    group['prop'] = births / births.sum()
    return group
names = ysGrouped.apply(add_prop)
names.head()
| name | sex | births | year | prop | |
|---|---|---|---|---|---|
| 0 | Mary | F | 7065 | 1880 | 0.077643 |
| 1 | Anna | F | 2604 | 1880 | 0.028618 |
| 2 | Emma | F | 2003 | 1880 | 0.022013 |
| 3 | Elizabeth | F | 1939 | 1880 | 0.021309 |
| 4 | Minnie | F | 1746 | 1880 | 0.019188 |
# 그룹별로 비율의 합이 1이 맞는지 확인
np.allclose(names.groupby(['year', 'sex']).prop.sum(), 1)
True
# 그룹별로 사용 빈도수가 높은 이름 1000 개 추출
def get_top1000(group):
    #group = group[group['prop'] > 0.01]  # 사용 비율로 필터링.
    return group.sort_values(by='births', ascending=False)[:1000]
top1000 = names.groupby(['year', 'sex']).apply(get_top1000)
top1000.index = np.arange(len(top1000))
top1000.head()
| name | sex | births | year | prop | |
|---|---|---|---|---|---|
| 0 | Mary | F | 7065 | 1880 | 0.077643 |
| 1 | Anna | F | 2604 | 1880 | 0.028618 |
| 2 | Emma | F | 2003 | 1880 | 0.022013 |
| 3 | Elizabeth | F | 1939 | 1880 | 0.021309 |
| 4 | Minnie | F | 1746 | 1880 | 0.019188 |
top1000.tail()
| name | sex | births | year | prop | |
|---|---|---|---|---|---|
| 261872 | Camilo | M | 194 | 2010 | 0.000102 |
| 261873 | Destin | M | 194 | 2010 | 0.000102 |
| 261874 | Jaquan | M | 194 | 2010 | 0.000102 |
| 261875 | Jaydan | M | 194 | 2010 | 0.000102 |
| 261876 | Maxton | M | 193 | 2010 | 0.000102 |
이름 유행 분석
boys = top1000[top1000.sex == 'M']
girls = top1000[top1000.sex == 'F']
girls.shape
(130880, 5)
girls.head()
| name | sex | births | year | prop | |
|---|---|---|---|---|---|
| 0 | Mary | F | 7065 | 1880 | 0.077643 |
| 1 | Anna | F | 2604 | 1880 | 0.028618 |
| 2 | Emma | F | 2003 | 1880 | 0.022013 |
| 3 | Elizabeth | F | 1939 | 1880 | 0.021309 |
| 4 | Minnie | F | 1746 | 1880 | 0.019188 |
# pandas groupby --> dataframe --> sort
girlsRating = pd.DataFrame(girls.groupby('name').births.sum())
girlsRating.sort_values(by='births', ascending=False).head()
| births | |
|---|---|
| name | |
| Mary | 4103935 |
| Patricia | 1568737 |
| Elizabeth | 1561874 |
| Jennifer | 1454725 |
| Linda | 1448771 |
# 각 이름의 년도별 사용 트렌드
total_births = top1000.pivot_table('births', index='year', columns='name', aggfunc=sum)
total_births.tail()
| name | Aaden | Aaliyah | Aarav | Aaron | Aarush | Ab | Abagail | Abb | Abbey | Abbie | ... | Zoa | Zoe | Zoey | Zoie | Zola | Zollie | Zona | Zora | Zula | Zuri |
|---|---|---|---|---|---|---|---|---|---|---|---|---|---|---|---|---|---|---|---|---|---|
| year | |||||||||||||||||||||
| 2006 | NaN | 3737.0 | NaN | 8279.0 | NaN | NaN | 297.0 | NaN | 404.0 | 440.0 | ... | NaN | 5145.0 | 2839.0 | 530.0 | NaN | NaN | NaN | NaN | NaN | NaN |
| 2007 | NaN | 3941.0 | NaN | 8914.0 | NaN | NaN | 313.0 | NaN | 349.0 | 468.0 | ... | NaN | 4925.0 | 3028.0 | 526.0 | NaN | NaN | NaN | NaN | NaN | NaN |
| 2008 | 955.0 | 4028.0 | 219.0 | 8511.0 | NaN | NaN | 317.0 | NaN | 344.0 | 400.0 | ... | NaN | 4764.0 | 3438.0 | 492.0 | NaN | NaN | NaN | NaN | NaN | NaN |
| 2009 | 1265.0 | 4352.0 | 270.0 | 7936.0 | NaN | NaN | 296.0 | NaN | 307.0 | 369.0 | ... | NaN | 5120.0 | 3981.0 | 496.0 | NaN | NaN | NaN | NaN | NaN | NaN |
| 2010 | 448.0 | 4628.0 | 438.0 | 7374.0 | 226.0 | NaN | 277.0 | NaN | 295.0 | 324.0 | ... | NaN | 6200.0 | 5164.0 | 504.0 | NaN | NaN | NaN | NaN | NaN | 258.0 |
5 rows × 6868 columns
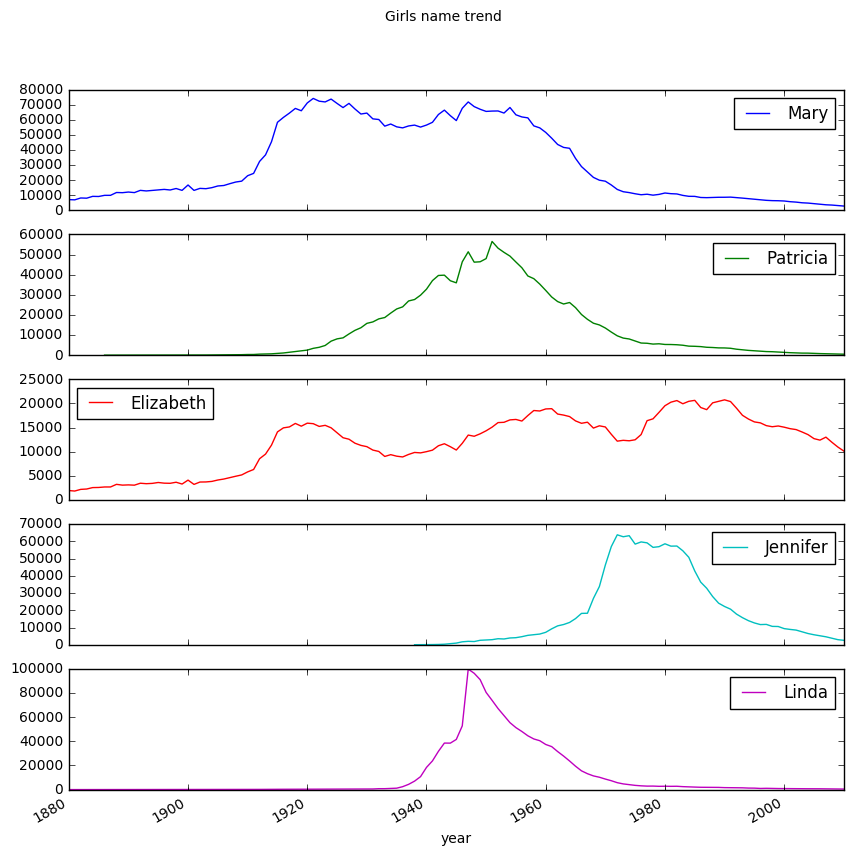
# 여자 이름 상위 5개
subset = total_births[['Mary', 'Patricia', 'Elizabeth', 'Jennifer', 'Linda']]
subset.plot(subplots=True, figsize=(10,10), grid=False, title='Girls name trend')
array([<matplotlib.axes._subplots.AxesSubplot object at 0x11cb0bb00>,
       <matplotlib.axes._subplots.AxesSubplot object at 0x11a118fd0>,
       <matplotlib.axes._subplots.AxesSubplot object at 0x11bc15940>,
       <matplotlib.axes._subplots.AxesSubplot object at 0x11bc02748>,
       <matplotlib.axes._subplots.AxesSubplot object at 0x11768b588>], dtype=object)
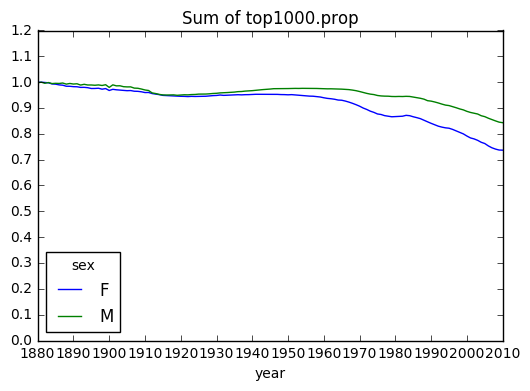
# 상위 이름 1000개가 전체에서 차지하는 비율
table = top1000.pivot_table('prop', index='year', columns='sex', aggfunc=sum)
table.plot(title='Sum of top1000.prop',
           yticks=np.linspace(0, 1.2, 13), xticks=range(1880, 2020, 10))
<matplotlib.axes._subplots.AxesSubplot at 0x11d0e6748>
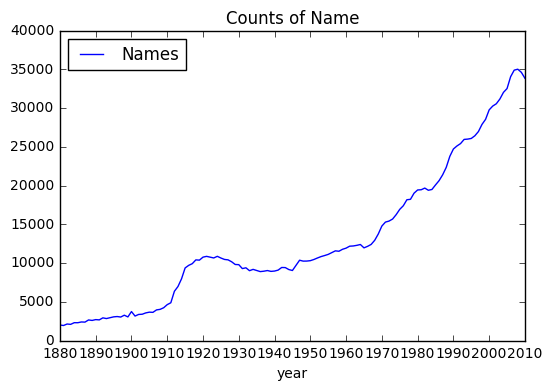
# 년도별 사용하는 이름 갯수 - 점점 더 다양한 이름을 사용하는 경향
nameCounts = pd.DataFrame(names.groupby('year').size())
nameCounts.columns = ['Names']
nameCounts.plot(title='Counts of Name', yticks=np.linspace(0, 40000, 9), xticks=range(1880, 2020, 10))
<matplotlib.axes._subplots.AxesSubplot at 0x1192b4978>
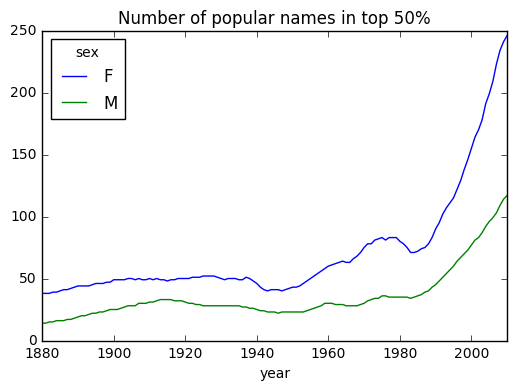
# 남녀별 사용하는 이름의 다양성 비교 (전체의 50% 차지하는 이름의 갯수)
def get_quantile_count(group, q=0.5):
    group = group.sort_values(by='prop', ascending=False)    # 그룹별 prop 기준 정렬
    return group.prop.cumsum().values.searchsorted(q) + 1   # prop 누계가 0.5인 index 찾기
diversity = top1000.groupby(['year', 'sex']).apply(get_quantile_count)
diversity = diversity.unstack('sex')   # 결과를 표로 재배치
diversity.tail()
| sex | F | M |
|---|---|---|
| year | ||
| 2006 | 209 | 99 |
| 2007 | 223 | 103 |
| 2008 | 234 | 109 |
| 2009 | 241 | 114 |
| 2010 | 246 | 117 |
diversity.plot(title="Number of popular names in top 50%")
# 여자 이름이 남자 이름보다 더 다양. 시간이 흐를수록 다양성 높아짐.
<matplotlib.axes._subplots.AxesSubplot at 0x11d0f54a8>
마지막 글자의 변화
get_last_letter = lambda x: x[-1]
last_letters = names.name.map(get_last_letter)
last_letters.name = 'last_letter'
# 년도별, 성별 마지막 글자
table = names.pivot_table('births', index=last_letters, columns=['sex', 'year'], aggfunc=sum)
table.head()
| sex | F | ... | M | ||||||||||||||||||
|---|---|---|---|---|---|---|---|---|---|---|---|---|---|---|---|---|---|---|---|---|---|
| year | 1880 | 1881 | 1882 | 1883 | 1884 | 1885 | 1886 | 1887 | 1888 | 1889 | ... | 2001 | 2002 | 2003 | 2004 | 2005 | 2006 | 2007 | 2008 | 2009 | 2010 |
| last_letter | |||||||||||||||||||||
| a | 31446.0 | 31581.0 | 36536.0 | 38330.0 | 43680.0 | 45408.0 | 49100.0 | 48942.0 | 59442.0 | 58631.0 | ... | 39124.0 | 38815.0 | 37825.0 | 38650.0 | 36838.0 | 36156.0 | 34654.0 | 32901.0 | 31430.0 | 28438.0 |
| b | NaN | NaN | NaN | NaN | NaN | NaN | NaN | NaN | NaN | NaN | ... | 50950.0 | 49284.0 | 48065.0 | 45914.0 | 43144.0 | 42600.0 | 42123.0 | 39945.0 | 38862.0 | 38859.0 |
| c | NaN | NaN | 5.0 | 5.0 | NaN | NaN | NaN | NaN | NaN | NaN | ... | 27113.0 | 27238.0 | 27697.0 | 26778.0 | 26078.0 | 26635.0 | 26864.0 | 25318.0 | 24048.0 | 23125.0 |
| d | 609.0 | 607.0 | 734.0 | 810.0 | 916.0 | 862.0 | 1007.0 | 1027.0 | 1298.0 | 1374.0 | ... | 60838.0 | 55829.0 | 53391.0 | 51754.0 | 50670.0 | 51410.0 | 50595.0 | 47910.0 | 46172.0 | 44398.0 |
| e | 33378.0 | 34080.0 | 40399.0 | 41914.0 | 48089.0 | 49616.0 | 53884.0 | 54353.0 | 66750.0 | 66663.0 | ... | 145395.0 | 144651.0 | 144769.0 | 142098.0 | 141123.0 | 142999.0 | 143698.0 | 140966.0 | 135496.0 | 129012.0 |
5 rows × 262 columns
subtable = table.reindex(columns=[1950, 2010], level='year') # year 컬럼 기준으로 binning
subtable.head()
| sex | F | M | ||
|---|---|---|---|---|
| year | 1950 | 2010 | 1950 | 2010 |
| last_letter | ||||
| a | 576481.0 | 670605.0 | 4037.0 | 28438.0 |
| b | 17.0 | 450.0 | 1632.0 | 38859.0 |
| c | 16.0 | 946.0 | 6500.0 | 23125.0 |
| d | 4413.0 | 2607.0 | 263643.0 | 44398.0 |
| e | 376863.0 | 313833.0 | 168659.0 | 129012.0 |
letter_prop = subtable / subtable.sum().astype(float)
fig, axes = plt.subplots(2, 1, figsize=(10, 10))
letter_prop['M'].plot(kind='bar', rot=0, ax=axes[0], title='Male')
letter_prop['F'].plot(kind='bar', rot=0, ax=axes[1], title='Female', legend=False)
<matplotlib.axes._subplots.AxesSubplot at 0x11a680748>
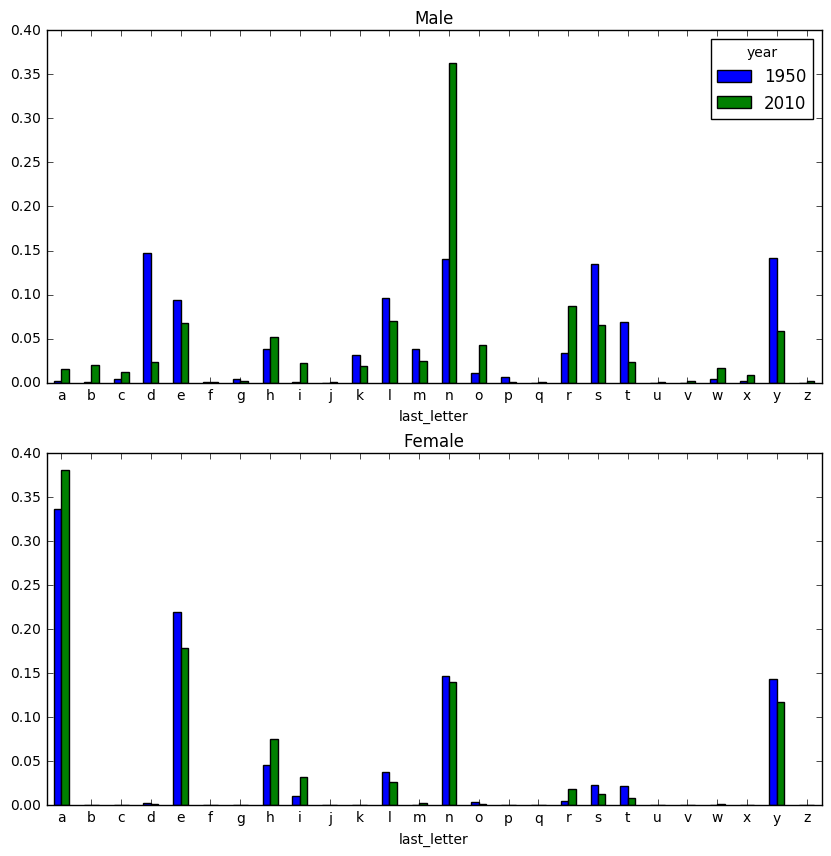
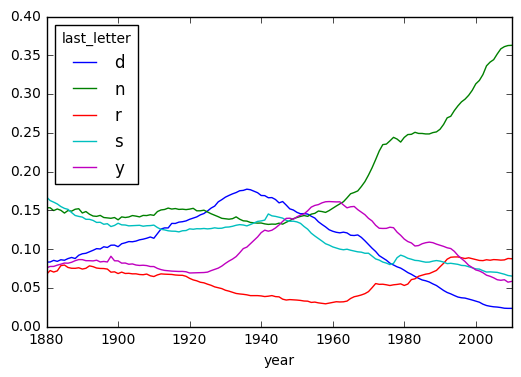
# 남자이름 d,n,r,s,y - 급격한 변화. 년도별 추세 확인.
letter_prop = table / table.sum().astype(float)
ts_5 = letter_prop.ix[['d', 'n', 'r', 's', 'y'], 'M'].T
ts_5.head()
| last_letter | d | n | r | s | y |
|---|---|---|---|---|---|
| year | |||||
| 1880 | 0.083055 | 0.153213 | 0.067461 | 0.167006 | 0.075760 |
| 1881 | 0.083247 | 0.153214 | 0.072190 | 0.162495 | 0.077451 |
| 1882 | 0.085340 | 0.149560 | 0.070263 | 0.160441 | 0.077537 |
| 1883 | 0.084066 | 0.151646 | 0.071775 | 0.158116 | 0.079144 |
| 1884 | 0.086120 | 0.149915 | 0.078492 | 0.154764 | 0.080405 |
plt.close('all')
ts_5.plot()   # 1960년대 이후로 n으로 끝나는 남자이름 급격한 증가.
<matplotlib.axes._subplots.AxesSubplot at 0x11d14f390>
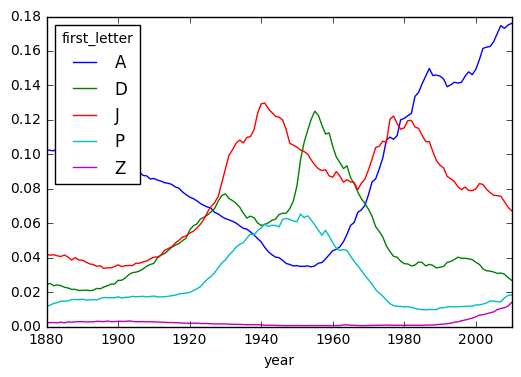
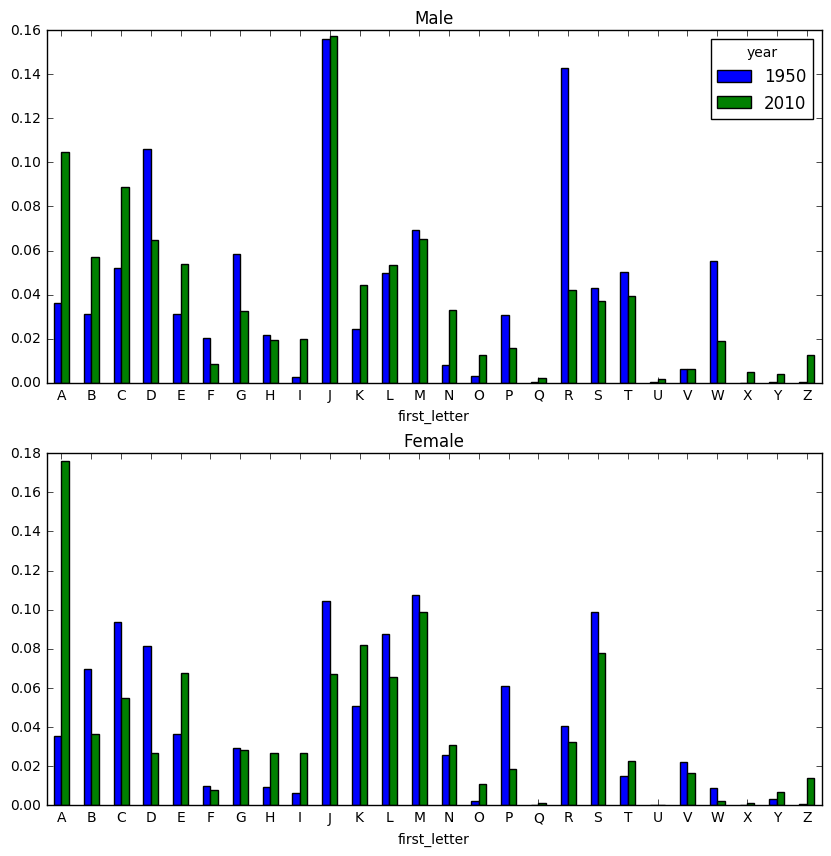
첫글자의 변화 추세
get_first_letter = lambda x: x[0]
first_letters = names.name.map(get_first_letter)
first_letters.name = 'first_letter'
table = names.pivot_table('births', index=first_letters, columns=['sex', 'year'], aggfunc=sum)
table.head()
| sex | F | ... | M | ||||||||||||||||||
|---|---|---|---|---|---|---|---|---|---|---|---|---|---|---|---|---|---|---|---|---|---|
| year | 1880 | 1881 | 1882 | 1883 | 1884 | 1885 | 1886 | 1887 | 1888 | 1889 | ... | 2001 | 2002 | 2003 | 2004 | 2005 | 2006 | 2007 | 2008 | 2009 | 2010 |
| first_letter | |||||||||||||||||||||
| A | 9334.0 | 9405.0 | 11001.0 | 11632.0 | 13324.0 | 13437.0 | 14416.0 | 14836.0 | 17729.0 | 17689.0 | ... | 189874.0 | 195896.0 | 208421.0 | 214679.0 | 216042.0 | 224793.0 | 225091.0 | 220998.0 | 211190.0 | 198870.0 |
| B | 3874.0 | 4013.0 | 4824.0 | 5194.0 | 6005.0 | 6340.0 | 6990.0 | 7110.0 | 8775.0 | 8744.0 | ... | 102260.0 | 102009.0 | 103251.0 | 104295.0 | 105325.0 | 108233.0 | 111282.0 | 112743.0 | 109937.0 | 108460.0 |
| C | 5868.0 | 5661.0 | 6454.0 | 6857.0 | 7919.0 | 8164.0 | 8412.0 | 8605.0 | 10412.0 | 10257.0 | ... | 176796.0 | 171727.0 | 176042.0 | 176323.0 | 175163.0 | 179372.0 | 182358.0 | 181352.0 | 178370.0 | 168356.0 |
| D | 2218.0 | 2299.0 | 2557.0 | 2709.0 | 3060.0 | 3031.0 | 3231.0 | 3144.0 | 3852.0 | 3732.0 | ... | 154619.0 | 151285.0 | 153742.0 | 149913.0 | 148518.0 | 149656.0 | 149211.0 | 139763.0 | 131635.0 | 123298.0 |
| E | 11444.0 | 11742.0 | 13771.0 | 14449.0 | 16465.0 | 17379.0 | 18825.0 | 19140.0 | 23258.0 | 23244.0 | ... | 84224.0 | 90358.0 | 94306.0 | 99243.0 | 99529.0 | 100967.0 | 103119.0 | 103479.0 | 103128.0 | 102513.0 |
5 rows × 262 columns
subtable = table.reindex(columns=[1950, 2010], level='year') # year 컬럼 기준으로 binning
subtable.head()
| sex | F | M | ||
|---|---|---|---|---|
| year | 1950 | 2010 | 1950 | 2010 |
| first_letter | ||||
| A | 60581.0 | 309608.0 | 64834.0 | 198870.0 |
| B | 118942.0 | 64191.0 | 55989.0 | 108460.0 |
| C | 160638.0 | 96780.0 | 92828.0 | 168356.0 |
| D | 139818.0 | 47211.0 | 189534.0 | 123298.0 |
| E | 62897.0 | 118824.0 | 56076.0 | 102513.0 |
letter_prop = subtable / subtable.sum().astype(float)
fig, axes = plt.subplots(2, 1, figsize=(10, 10))
letter_prop['M'].plot(kind='bar', rot=0, ax=axes[0], title='Male')
letter_prop['F'].plot(kind='bar', rot=0, ax=axes[1], title='Female', legend=False)
<matplotlib.axes._subplots.AxesSubplot at 0x11d4e5ba8>
letter_prop = table / table.sum().astype(float)
ts_5 = letter_prop.ix[['A', 'D', 'J', 'P', 'Z'], 'F'].T
ts_5.head()
| first_letter | A | D | J | P | Z |
|---|---|---|---|---|---|
| year | |||||
| 1880 | 0.102579 | 0.024376 | 0.041772 | 0.011693 | 0.002099 |
| 1881 | 0.102278 | 0.025001 | 0.041466 | 0.012441 | 0.002284 |
| 1882 | 0.102002 | 0.023709 | 0.041641 | 0.013370 | 0.002281 |
| 1883 | 0.103559 | 0.024118 | 0.041061 | 0.013924 | 0.002146 |
| 1884 | 0.103270 | 0.023717 | 0.040606 | 0.014641 | 0.002558 |
plt.close('all')
ts_5.plot()
# 1920 ~ 60년대에는 A 대신 D 또는 J 로 시작하는 이름이 유행.
# 1990년대에 Z로 시작하는 이름을 많이 사용하기 시작.
<matplotlib.axes._subplots.AxesSubplot at 0x11df86240>
