Tensorflow 서비스 이탈고객 예측
[딥러닝] Logistic Regression을 이용하여 서비스 이탈고객 예측 (Binary Classification)
import tensorflow as tf
import numpy as np
tf.set_random_seed(777)
1. 당뇨병 예측 모델링
# import data
xy = np.loadtxt('data/diabetes.csv', delimiter=',', dtype=np.float32)
x_data = xy[:, 0:-1]
y_data = xy[:, [-1]]
x_data.shape
(759, 8)
y_data.shape
(759, 1)
X = tf.placeholder(tf.float32, shape=[None, 8])
Y = tf.placeholder(tf.float32, shape=[None, 1])

W = tf.Variable(tf.random_normal([8, 1]), name='weight')
b = tf.Variable(tf.random_normal([1]), name='bias')
# Sigmoid function
hypothesis = tf.sigmoid(tf.matmul(X, W) + b)

cost = -tf.reduce_mean(Y * tf.log(hypothesis) + (1 - Y) * tf.log(1 - hypothesis))

train = tf.train.GradientDescentOptimizer(learning_rate=0.01).minimize(cost)
# hypothesis > 0.5 이면 True 아니면 False 처리.
predicted = tf.cast(hypothesis > 0.5, dtype=tf.float32)
accuracy = tf.reduce_mean(tf.cast(tf.equal(predicted, Y), dtype=tf.float32))
# Launch graph
with tf.Session() as sess:
    sess.run(tf.global_variables_initializer())

    for step in range(10001):
        cost_val, _ = sess.run([cost, train], feed_dict={X: x_data, Y: y_data})
        if step % 1000 == 0:
            print(step, cost_val)

    # Accuracy report
    h, c, a = sess.run([hypothesis, predicted, accuracy], feed_dict={X: x_data, Y: y_data})
0 0.82794
1000 0.669853
2000 0.606246
3000 0.566555
4000 0.541229
5000 0.524479
6000 0.512969
7000 0.504778
8000 0.498771
9000 0.494249
10000 0.490767
print("Hypothesis: \n", h[:10])
Hypothesis:
 [[ 0.44348484]
 [ 0.91536468]
 [ 0.22591162]
 [ 0.93583125]
 [ 0.33763626]
 [ 0.70926887]
 [ 0.94409138]
 [ 0.63417912]
 [ 0.25953037]
 [ 0.46434346]]
print("Predicted: \n", c[:10])
Predicted:
 [[ 0.]
 [ 1.]
 [ 0.]
 [ 1.]
 [ 0.]
 [ 1.]
 [ 1.]
 [ 1.]
 [ 0.]
 [ 0.]]
print("Accuracy: ", a)
Accuracy: 0.762846
2. 서비스 이탈자 예측 모델링
import pandas as pd
# features 확인
df = pd.read_csv('data/churnTrain.csv')
df.columns
Index(['account_length', 'international_plan', 'voice_mail_plan',
       'number_vmail_messages', 'total_day_minutes', 'total_day_calls',
       'total_day_charge', 'total_eve_minutes', 'total_eve_calls',
       'total_eve_charge', 'total_night_minutes', 'total_night_calls',
       'total_night_charge', 'total_intl_minutes', 'total_intl_calls',
       'total_intl_charge', 'number_customer_service_calls', 'churn'],
      dtype='object')
# churn : 서비스 이탈(해지) 여부
df.shape
(3333, 18)
Training Data
cData = np.loadtxt('data/churnTrain.csv', delimiter=',', dtype=np.float32, skiprows=1)
x_data = cData[:, 0:-1]
y_data = cData[:, [-1]]
x_data.shape
(3333, 17)
y_data.shape
(3333, 1)
# Standardzation
xn_data = (x_data - np.mean(x_data, axis=0)) / np.std(x_data, axis=0)
xn_data
array([[ 0.67649007, -0.32758394,  1.61706638, ..., -0.60119295,
        -0.08568114, -0.42793074],
       [ 0.14906523, -0.32758394,  1.61706638, ..., -0.60119295,
         1.24117649, -0.42793074],
       [ 0.90252924, -0.32758394, -0.61838871, ...,  0.21153317,
         0.69716471, -1.1882149 ],
       ...,
       [-1.83505678, -0.32758394, -0.61838871, ...,  0.61789626,
         1.38713062,  0.33235341],
       [ 2.08295631,  3.05271697, -0.61838871, ...,  2.2433486 ,
        -1.87693894,  0.33235341],
       [-0.6797452 , -0.32758394,  1.61706638, ..., -0.1948299 ,
         1.24117649, -1.1882149 ]], dtype=float32)
Test Data
cData2 = np.loadtxt('data/churnTest.csv', delimiter=',', dtype=np.float32, skiprows=1)
x2_data = cData2[:, 0:-1]
y2_data = cData2[:, [-1]]
# Standardzation
xn2_data = (x2_data - np.mean(x2_data, axis=0)) / np.std(x2_data, axis=0)
Modeling
X = tf.placeholder(tf.float32, shape=[None, 17])
Y = tf.placeholder(tf.float32, shape=[None, 1])

W = tf.Variable(tf.random_normal([17, 1]), name='weight')
b = tf.Variable(tf.random_normal([1]), name='bias')
hypothesis = tf.sigmoid(tf.matmul(X, W) + b)
cost = -tf.reduce_mean(Y * tf.log(hypothesis) + (1 - Y) * tf.log(1 - hypothesis))

train = tf.train.GradientDescentOptimizer(learning_rate=0.01).minimize(cost)
predicted = tf.cast(hypothesis > 0.5, dtype=tf.float32)
accuracy = tf.reduce_mean(tf.cast(tf.equal(predicted, Y), dtype=tf.float32))
Launch graph
with tf.Session() as sess:
    sess.run(tf.global_variables_initializer())

    for step in range(10001):
        cost_val, _ = sess.run([cost, train], feed_dict={X: xn_data, Y: y_data})
        if step % 1000 == 0:
            print(step, cost_val)

    # Accuracy report
    # Trainging Data
    h, c, a = sess.run([hypothesis, predicted, accuracy], feed_dict={X: xn_data, Y: y_data})
    # Test Data
    h2, c2, a2 = sess.run([hypothesis, predicted, accuracy], feed_dict={X: xn2_data, Y: y2_data})
0 1.54038
1000 0.379552
2000 0.33152
3000 0.326789
4000 0.326013
5000 0.325778
6000 0.32565
7000 0.325551
8000 0.325466
9000 0.325389
10000 0.325317
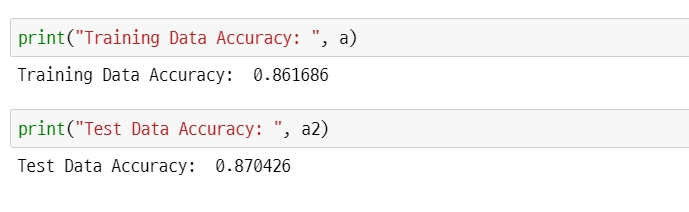
print("Training Data Accuracy: ", a)
Training Data Accuracy: 0.862286
print("Test Data Accuracy: ", a2)
Test Data Accuracy: 0.871026