웹사이트 접속자 분석
미 정부 사이트 접속자의 timezone별 OS 집계
1. usagov_bitly_data
- 출처 : “파이썬 라이브러리를 활용한 데이터분석 (웨스 맥키니)”
# 단축 url로 미국 정부 사이트에 접속한 사용자 정보.
path = 'data/usagov_bitly_data2012-03-16.txt'
open(path).readline()   # 1 line
'{ "a": "Mozilla\\/5.0 (Windows NT 6.1; WOW64) AppleWebKit\\/535.11 (KHTML, like Gecko) Chrome\\/17.0.963.78 Safari\\/535.11", "c": "US", "nk": 1, "tz": "America\\/New_York", "gr": "MA", "g": "A6qOVH", "h": "wfLQtf", "l": "orofrog", "al": "en-US,en;q=0.8", "hh": "1.usa.gov", "r": "http:\\/\\/www.facebook.com\\/l\\/7AQEFzjSi\\/1.usa.gov\\/wfLQtf", "u": "http:\\/\\/www.ncbi.nlm.nih.gov\\/pubmed\\/22415991", "t": 1331923247, "hc": 1331822918, "cy": "Danvers", "ll": [ 42.576698, -70.954903 ] }\n'
import json
records = [json.loads(line) for line in open(path)]   # 각 라인별로 json.loads 함수 적용.
records[0]
{'a': 'Mozilla/5.0 (Windows NT 6.1; WOW64) AppleWebKit/535.11 (KHTML, like Gecko) Chrome/17.0.963.78 Safari/535.11',
 'al': 'en-US,en;q=0.8',
 'c': 'US',
 'cy': 'Danvers',
 'g': 'A6qOVH',
 'gr': 'MA',
 'h': 'wfLQtf',
 'hc': 1331822918,
 'hh': '1.usa.gov',
 'l': 'orofrog',
 'll': [42.576698, -70.954903],
 'nk': 1,
 'r': 'http://www.facebook.com/l/7AQEFzjSi/1.usa.gov/wfLQtf',
 't': 1331923247,
 'tz': 'America/New_York',
 'u': 'http://www.ncbi.nlm.nih.gov/pubmed/22415991'}
Time Zone 집계
# 'tz' 없는 항목 체크하여 제외.
tz = [rec['tz'] for rec in records if 'tz' in rec and len(rec['tz'])>0]   # --> list
tz[:10]
['America/New_York',
 'America/Denver',
 'America/New_York',
 'America/Sao_Paulo',
 'America/New_York',
 'America/New_York',
 'Europe/Warsaw',
 'America/Los_Angeles',
 'America/New_York',
 'America/New_York']
len(tz)
2919
# timezone 빈도수 집계
def get_counts(sequence):
    tzDic = {}
    for x in sequence:
        if x in tzDic:
            tzDic[x] += 1
        else:
            tzDic[x] = 1
    return tzDic
counts = get_counts(tz)
counts.keys()
dict_keys(['Asia/Jakarta', 'Europe/Belgrade', 'Asia/Istanbul', 'America/New_York', 'Asia/Pontianak', 'Africa/Casablanca', 'America/Mexico_City', 'Asia/Seoul', 'Europe/Volgograd', 'America/Caracas', 'Europe/Warsaw', 'Asia/Karachi', 'Asia/Kuala_Lumpur', 'Asia/Harbin', 'America/Puerto_Rico', 'America/Managua', 'America/Montreal', 'America/Costa_Rica', 'Europe/Amsterdam', 'Europe/Sofia', 'Europe/London', 'Africa/Ceuta', 'America/Santo_Domingo', 'Asia/Kuching', 'America/Mazatlan', 'Europe/Stockholm', 'America/Denver', 'Europe/Lisbon', 'Europe/Vilnius', 'America/Argentina/Buenos_Aires', 'Europe/Budapest', 'America/Montevideo', 'America/Los_Angeles', 'America/Guayaquil', 'America/Bogota', 'Europe/Bucharest', 'Africa/Cairo', 'Europe/Paris', 'America/Rainy_River', 'Europe/Athens', 'America/Halifax', 'Africa/Johannesburg', 'Europe/Copenhagen', 'Asia/Novosibirsk', 'Europe/Prague', 'Asia/Jerusalem', 'Australia/NSW', 'America/Argentina/Cordoba', 'Europe/Ljubljana', 'Asia/Nicosia', 'Pacific/Auckland', 'Europe/Dublin', 'America/Anchorage', 'Asia/Beirut', 'Asia/Amman', 'Africa/Lusaka', 'Europe/Vienna', 'Europe/Madrid', 'America/Edmonton', 'Pacific/Honolulu', 'America/Sao_Paulo', 'Asia/Riyadh', 'Asia/Tokyo', 'America/Phoenix', 'Europe/Rome', 'Chile/Continental', 'Australia/Queensland', 'Asia/Manila', 'Europe/Brussels', 'Asia/Hong_Kong', 'America/Vancouver', 'Europe/Bratislava', 'America/Chihuahua', 'Asia/Bangkok', 'Europe/Skopje', 'America/St_Kitts', 'Europe/Riga', 'America/Lima', 'America/Argentina/Mendoza', 'Asia/Yekaterinburg', 'America/La_Paz', 'Europe/Malta', 'Asia/Calcutta', 'Europe/Zurich', 'America/Tegucigalpa', 'Europe/Moscow', 'Europe/Berlin', 'America/Recife', 'Europe/Uzhgorod', 'America/Monterrey', 'Europe/Oslo', 'Asia/Dubai', 'America/Chicago', 'Europe/Helsinki', 'America/Winnipeg', 'America/Indianapolis'])
counts['Asia/Seoul']
5
# 상위 10개 timezone
def top_counts(count_dict, n=10):
    value_key_pairs = [(count, tz) for tz, count in count_dict.items()]   # sorting을 위해 value를 앞에 위치.
    value_key_pairs.sort()
    return value_key_pairs[-n:]
top_counts(counts)
[(28, 'Europe/Berlin'),
 (33, 'America/Sao_Paulo'),
 (35, 'Europe/Madrid'),
 (36, 'Pacific/Honolulu'),
 (37, 'Asia/Tokyo'),
 (74, 'Europe/London'),
 (191, 'America/Denver'),
 (382, 'America/Los_Angeles'),
 (400, 'America/Chicago'),
 (1251, 'America/New_York')]
# 상위 10개 - Counter 함수 사용
from collections import Counter
counts = Counter(tz)
counts.most_common(10)
[('America/New_York', 1251),
 ('America/Chicago', 400),
 ('America/Los_Angeles', 382),
 ('America/Denver', 191),
 ('Europe/London', 74),
 ('Asia/Tokyo', 37),
 ('Pacific/Honolulu', 36),
 ('Europe/Madrid', 35),
 ('America/Sao_Paulo', 33),
 ('Europe/Berlin', 28)]
pandas로 Time Zone 집계
from pandas import DataFrame, Series
import pandas as pd
import numpy as np
df = DataFrame(records)   # json으로 읽은 내용을 dataframe으로 변환.
df.head()
| _heartbeat_ | a | al | c | cy | g | gr | h | hc | hh | kw | l | ll | nk | r | t | tz | u | |
|---|---|---|---|---|---|---|---|---|---|---|---|---|---|---|---|---|---|---|
| 0 | NaN | Mozilla/5.0 (Windows NT 6.1; WOW64) AppleWebKi... | en-US,en;q=0.8 | US | Danvers | A6qOVH | MA | wfLQtf | 1.331823e+09 | 1.usa.gov | NaN | orofrog | [42.576698, -70.954903] | 1.0 | http://www.facebook.com/l/7AQEFzjSi/1.usa.gov/... | 1.331923e+09 | America/New_York | http://www.ncbi.nlm.nih.gov/pubmed/22415991 |
| 1 | NaN | GoogleMaps/RochesterNY | NaN | US | Provo | mwszkS | UT | mwszkS | 1.308262e+09 | j.mp | NaN | bitly | [40.218102, -111.613297] | 0.0 | http://www.AwareMap.com/ | 1.331923e+09 | America/Denver | http://www.monroecounty.gov/etc/911/rss.php |
| 2 | NaN | Mozilla/4.0 (compatible; MSIE 8.0; Windows NT ... | en-US | US | Washington | xxr3Qb | DC | xxr3Qb | 1.331920e+09 | 1.usa.gov | NaN | bitly | [38.9007, -77.043098] | 1.0 | http://t.co/03elZC4Q | 1.331923e+09 | America/New_York | http://boxer.senate.gov/en/press/releases/0316... |
| 3 | NaN | Mozilla/5.0 (Macintosh; Intel Mac OS X 10_6_8)... | pt-br | BR | Braz | zCaLwp | 27 | zUtuOu | 1.331923e+09 | 1.usa.gov | NaN | alelex88 | [-23.549999, -46.616699] | 0.0 | direct | 1.331923e+09 | America/Sao_Paulo | http://apod.nasa.gov/apod/ap120312.html |
| 4 | NaN | Mozilla/5.0 (Windows NT 6.1; WOW64) AppleWebKi... | en-US,en;q=0.8 | US | Shrewsbury | 9b6kNl | MA | 9b6kNl | 1.273672e+09 | bit.ly | NaN | bitly | [42.286499, -71.714699] | 0.0 | http://www.shrewsbury-ma.gov/selco/ | 1.331923e+09 | America/New_York | http://www.shrewsbury-ma.gov/egov/gallery/1341... |
tz_counts = df['tz'].value_counts()   # = dataframe row count
tz_counts[:10]
America/New_York       1251
                        521
America/Chicago         400
America/Los_Angeles     382
America/Denver          191
Europe/London            74
Asia/Tokyo               37
Pacific/Honolulu         36
Europe/Madrid            35
America/Sao_Paulo        33
Name: tz, dtype: int64
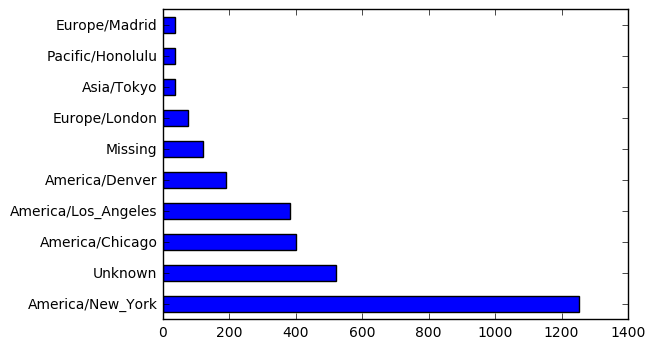
clean_tz = df['tz'].fillna('Missing')   # NA 처리
clean_tz[clean_tz == ''] = 'Unknown'    # 값 없는 것 처리
tz_counts = clean_tz.value_counts()
tz_counts[:10]
America/New_York       1251
Unknown                 521
America/Chicago         400
America/Los_Angeles     382
America/Denver          191
Missing                 120
Europe/London            74
Asia/Tokyo               37
Pacific/Honolulu         36
Europe/Madrid            35
Name: tz, dtype: int64
%matplotlib inline
import matplotlib.pyplot as plt
plt.figure()
tz_counts[:10].plot(kind='barh')   # plt 레이어 위에 dataframe.plot
<matplotlib.axes._subplots.AxesSubplot at 0x1137cb6d8>

OS 집계
df.a[0].split() # split string
['Mozilla/5.0',
 '(Windows',
 'NT',
 '6.1;',
 'WOW64)',
 'AppleWebKit/535.11',
 '(KHTML,',
 'like',
 'Gecko)',
 'Chrome/17.0.963.78',
 'Safari/535.11']
results = Series([x.split()[0] for x in df.a.dropna()])  # a:useragent. NA 항목 제외. --> Series로 리턴
results.value_counts()[:10]
Mozilla/5.0                 2594
Mozilla/4.0                  601
GoogleMaps/RochesterNY       121
Opera/9.80                    34
TEST_INTERNET_AGENT           24
GoogleProducer                21
Mozilla/6.0                    5
BlackBerry8520/5.0.0.681       4
Dalvik/1.4.0                   3
BlackBerry8520/5.0.0.592       3
dtype: int64
# null 항목 제외하고 Win / Not Win 구분
odf = df[df.a.notnull()]
odf.a.head()
0    Mozilla/5.0 (Windows NT 6.1; WOW64) AppleWebKi...
1                               GoogleMaps/RochesterNY
2    Mozilla/4.0 (compatible; MSIE 8.0; Windows NT ...
3    Mozilla/5.0 (Macintosh; Intel Mac OS X 10_6_8)...
4    Mozilla/5.0 (Windows NT 6.1; WOW64) AppleWebKi...
Name: a, dtype: object
browserOS = np.where(odf['a'].str.contains('Windows'), 'Windows', 'Not Windows')
browserOS
array(['Windows', 'Not Windows', 'Windows', ..., 'Not Windows',
       'Not Windows', 'Windows'],
      dtype='<U11')
# Grouping by timezone & os
by_tz_os = odf.groupby(['tz', browserOS])
print(by_tz_os)
<pandas.core.groupby.DataFrameGroupBy object at 0x115c29dd8>
agg_counts = by_tz_os.size().unstack().fillna(0)   # size : 그룹별 갯수 집계 / unstack : 결과를 표로 재배치.
agg_counts[:10]
| Not Windows | Windows | |
|---|---|---|
| tz | ||
| 245.0 | 276.0 | |
| Africa/Cairo | 0.0 | 3.0 |
| Africa/Casablanca | 0.0 | 1.0 |
| Africa/Ceuta | 0.0 | 2.0 |
| Africa/Johannesburg | 0.0 | 1.0 |
| Africa/Lusaka | 0.0 | 1.0 |
| America/Anchorage | 4.0 | 1.0 |
| America/Argentina/Buenos_Aires | 1.0 | 0.0 |
| America/Argentina/Cordoba | 0.0 | 1.0 |
| America/Argentina/Mendoza | 0.0 | 1.0 |
indexer = agg_counts.sum(1).argsort()  # Asc. 표시된 값은 각 항목의 sorting된 인덱스 값.
indexer[:10]
tz
                                  24
Africa/Cairo                      20
Africa/Casablanca                 21
Africa/Ceuta                      92
Africa/Johannesburg               87
Africa/Lusaka                     53
America/Anchorage                 54
America/Argentina/Buenos_Aires    57
America/Argentina/Cordoba         26
America/Argentina/Mendoza         55
dtype: int64
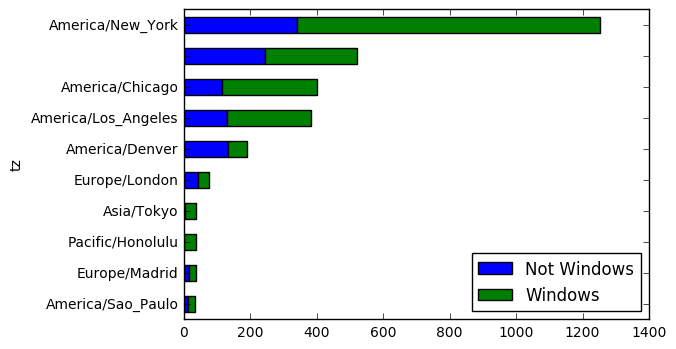
count_subset = agg_counts.take(indexer)[-10:]  # 상위 10개
count_subset
| Not Windows | Windows | |
|---|---|---|
| tz | ||
| America/Sao_Paulo | 13.0 | 20.0 |
| Europe/Madrid | 16.0 | 19.0 |
| Pacific/Honolulu | 0.0 | 36.0 |
| Asia/Tokyo | 2.0 | 35.0 |
| Europe/London | 43.0 | 31.0 |
| America/Denver | 132.0 | 59.0 |
| America/Los_Angeles | 130.0 | 252.0 |
| America/Chicago | 115.0 | 285.0 |
| 245.0 | 276.0 | |
| America/New_York | 339.0 | 912.0 |
plt.figure()
count_subset.plot(kind='barh', stacked=True)  # stacked : 중첩 그래프
<matplotlib.axes._subplots.AxesSubplot at 0x1162566d8>


<matplotlib.figure.Figure at 0x115c572b0>

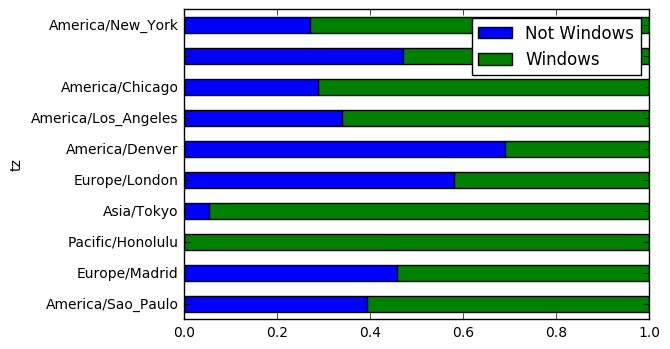
# win / not win 상대적인 비율 보기위해 정규화. sum(1) : 총합이 1이 되도록.
plt.figure()
normed_subset = count_subset.div(count_subset.sum(1), axis=0)
normed_subset.plot(kind='barh', stacked=True)
<matplotlib.axes._subplots.AxesSubplot at 0x115bd1550>


<matplotlib.figure.Figure at 0x116440860>

