Python Linear Model
Linear Regression Plot with Seaborn, 통계를 위한 statsmodels 라이브러리
Seaborn
Python에서 많이 쓰이는 시각화 라이브러리. http://seaborn.pydata.org
%matplotlib inline
import pandas as pd
import seaborn as sb
import matplotlib as plt
cars = pd.read_csv('automobile.csv')
cars.head()
| symboling | maker | fuel | aspiration | doors | body | wheels | engine_location | wheel_base | ... | |
|---|---|---|---|---|---|---|---|---|---|---|
| 0 | 2 | audi | gas | std | four | sedan | fwd | front | 99.8 | ... |
| 1 | 2 | audi | gas | std | four | sedan | 4wd | front | 99.4 | ... |
| 2 | 1 | audi | gas | std | four | sedan | fwd | front | 105.8 | ... |
| 3 | 1 | audi | gas | turbo | four | sedan | fwd | front | 105.8 | ... |
| 4 | 2 | bmw | gas | std | two | sedan | rwd | front | 101.2 | ... |
5 rows × 26 columns
cars.columns
Index(['symboling', 'normalized_losses', 'maker', 'fuel', 'aspiration',
       'doors', 'body', 'wheels', 'engine_location', 'wheel_base', 'length',
       'width', 'height', 'curb_weight', 'engine_type', 'cylinders',
       'engine_size', 'fuel_system', 'bore', 'stroke', 'compression_ratio',
       'horsepower', 'peak_rpm', 'city_mpg', 'highway_mpg', 'price'],
      dtype='object')
Regression Plot
# 노트북에 표시되는 plot 크기 조절
fig = plt.pyplot.gcf()
fig.set_size_inches(16, 10)
<matplotlib.figure.Figure at 0x28d98908898>
sb.regplot(cars.length, cars.symboling)
<matplotlib.axes._subplots.AxesSubplot at 0x28d989199b0>
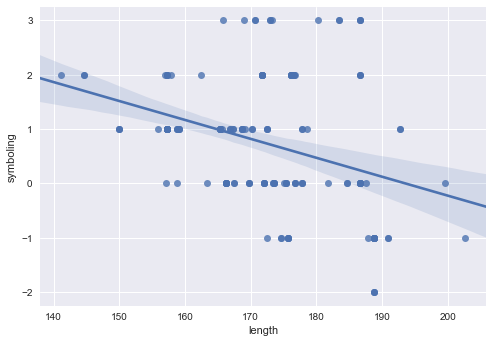
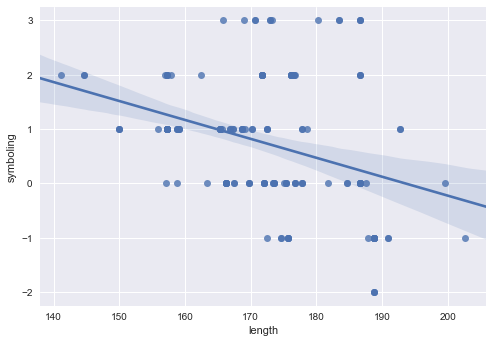
sb.regplot('length', 'symboling', data=cars)
<matplotlib.axes._subplots.AxesSubplot at 0x28d989d5630>
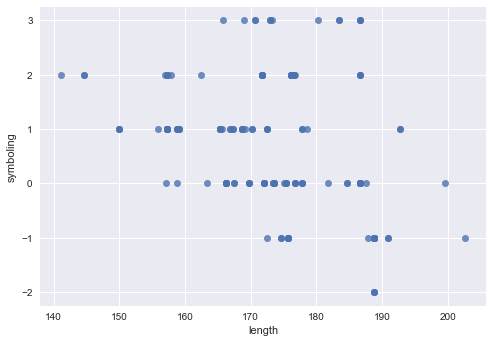
# 회귀선 지우기
sb.regplot('length', 'symboling', data=cars, fit_reg=False)
<matplotlib.axes._subplots.AxesSubplot at 0x28d98a33b38>
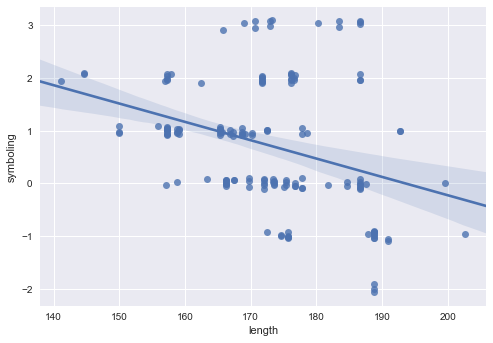
# jitter
sb.regplot('length', 'symboling', data=cars, y_jitter=0.1)
<matplotlib.axes._subplots.AxesSubplot at 0x28d98be3be0>
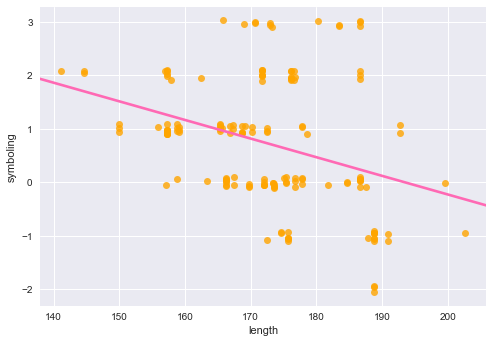
# 신뢰구간(ci) 지우기. 회귀선 색상. 점 색상.
sb.regplot('length', 'symboling', data=cars, y_jitter=0.1, ci=None,
           line_kws={'color': 'hotpink'},
           scatter_kws={'color': 'orange'})   # 16진수('FF9900')로 색상 지정 가능.
<matplotlib.axes._subplots.AxesSubplot at 0x28d98c24320>
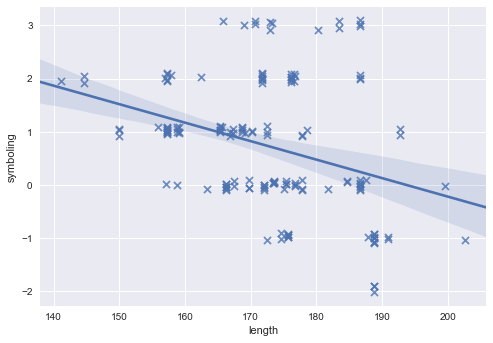
# 점 모양과 크기
http://matplotlib.org/api/markers_api.html#module-matplotlib.markers
sb.regplot('length', 'symboling', data=cars, y_jitter=0.1, marker='x', scatter_kws={'s': 50})
<matplotlib.axes._subplots.AxesSubplot at 0x28d98c8ce48>
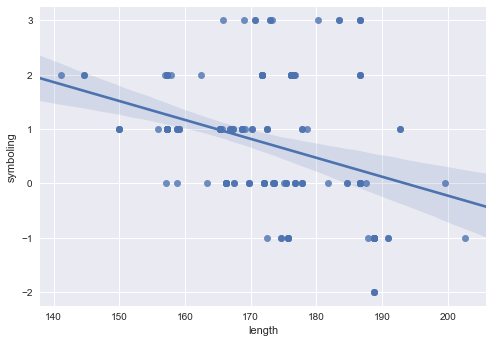
# save plot
plot = sb.regplot('length', 'symboling', data=cars)
plot.get_figure().savefig('plot.png')
statsmodels
Python에서 통계 분석을 위한 라이브러리. http://statsmodels.sourceforge.net/
import statsmodels.formula.api as smf
model = smf.ols('symboling ~ length', data=cars)
result = model.fit()
result.summary()
| Dep. Variable: | symboling | R-squared: | 0.113 |
|---|---|---|---|
| Model: | OLS | Adj. R-squared: | 0.107 |
| Method: | Least Squares | F-statistic: | 20.01 |
| Date: | Sat, 25 Mar 2017 | Prob (F-statistic): | 1.47e-05 |
| Time: | 10:47:16 | Log-Likelihood: | -243.64 |
| No. Observations: | 159 | AIC: | 491.3 |
| Df Residuals: | 157 | BIC: | 497.4 |
| Df Model: | 1 | ||
| Covariance Type: | nonrobust |
| coef | std err | t | P>|t| | [95.0% Conf. Int.] | |
|---|---|---|---|---|---|
| Intercept | 6.7385 | 1.345 | 5.011 | 0.000 | 4.082 9.395 |
| length | -0.0348 | 0.008 | -4.474 | 0.000 | -0.050 -0.019 |
| Omnibus: | 10.632 | Durbin-Watson: | 0.909 |
|---|---|---|---|
| Prob(Omnibus): | 0.005 | Jarque-Bera (JB): | 11.510 |
| Skew: | 0.658 | Prob(JB): | 0.00317 |
| Kurtosis: | 2.915 | Cond. No. | 2.60e+03 |
model = smf.ols('symboling ~ length + price', data=cars).fit().summary()
# smf.ols('symboling ~ .', data=cont_data).fit().summary() # ~ 다음에 '.' 인식 안됨
연속형 / 범주형 변수 구분
cars.columns
Index(['symboling', 'normalized_losses', 'maker', 'fuel', 'aspiration',
       'doors', 'body', 'wheels', 'engine_location', 'wheel_base', 'length',
       'width', 'height', 'curb_weight', 'engine_type', 'cylinders',
       'engine_size', 'fuel_system', 'bore', 'stroke', 'compression_ratio',
       'horsepower', 'peak_rpm', 'city_mpg', 'highway_mpg', 'price'],
      dtype='object')
cont_var = cars.columns[cars.dtypes != 'object']
cont_var
Index(['symboling', 'normalized_losses', 'wheel_base', 'length', 'width',
       'height', 'curb_weight', 'engine_size', 'bore', 'stroke',
       'compression_ratio', 'horsepower', 'peak_rpm', 'city_mpg',
       'highway_mpg', 'price'],
      dtype='object')
cate_var = cars.columns[cars.dtypes == 'object']
cate_var
Index(['maker', 'fuel', 'aspiration', 'doors', 'body', 'wheels',
       'engine_location', 'engine_type', 'cylinders', 'fuel_system'],
      dtype='object')
cars[cate_var].head()
| maker | fuel | aspiration | doors | body | wheels | engine_location | engine_type | cylinders | fuel_system | |
|---|---|---|---|---|---|---|---|---|---|---|
| 0 | audi | gas | std | four | sedan | fwd | front | ohc | four | mpfi |
| 1 | audi | gas | std | four | sedan | 4wd | front | ohc | five | mpfi |
| 2 | audi | gas | std | four | sedan | fwd | front | ohc | five | mpfi |
| 3 | audi | gas | turbo | four | sedan | fwd | front | ohc | five | mpfi |
| 4 | bmw | gas | std | two | sedan | rwd | front | ohc | four | mpfi |
연속형 변수들만 사용 (범주형 변수 제외)
indep = ' + '.join(cont_var.difference(['symboling']))   # symboling 제외
indep
'bore + city_mpg + compression_ratio + curb_weight + engine_size + height + highway_mpg + horsepower + length + normalized_losses + peak_rpm + price + stroke + wheel_base + width'
smf.ols('symboling ~ ' + indep, data=cars).fit().summary()
| Dep. Variable: | symboling | R-squared: | 0.593 |
|---|---|---|---|
| Model: | OLS | Adj. R-squared: | 0.550 |
| Method: | Least Squares | F-statistic: | 13.89 |
| Date: | Sat, 25 Mar 2017 | Prob (F-statistic): | 3.68e-21 |
| Time: | 10:47:16 | Log-Likelihood: | -181.72 |
| No. Observations: | 159 | AIC: | 395.4 |
| Df Residuals: | 143 | BIC: | 444.5 |
| Df Model: | 15 | ||
| Covariance Type: | nonrobust |
| coef | std err | t | P>|t| | [95.0% Conf. Int.] | |
|---|---|---|---|---|---|
| Intercept | 3.3079 | 5.583 | 0.592 | 0.554 | -7.728 14.344 |
| bore | -0.1778 | 0.368 | -0.484 | 0.629 | -0.905 0.549 |
| city_mpg | -0.1086 | 0.052 | -2.072 | 0.040 | -0.212 -0.005 |
| compression_ratio | 0.0456 | 0.026 | 1.741 | 0.084 | -0.006 0.097 |
| curb_weight | -0.0007 | 0.001 | -1.179 | 0.241 | -0.002 0.000 |
| engine_size | 0.0030 | 0.006 | 0.471 | 0.638 | -0.010 0.016 |
| height | 0.0492 | 0.046 | 1.068 | 0.287 | -0.042 0.140 |
| highway_mpg | 0.0847 | 0.047 | 1.800 | 0.074 | -0.008 0.178 |
| horsepower | 0.0054 | 0.006 | 0.966 | 0.336 | -0.006 0.017 |
| length | 0.0050 | 0.016 | 0.310 | 0.757 | -0.027 0.037 |
| normalized_losses | 0.0140 | 0.002 | 6.236 | 0.000 | 0.010 0.018 |
| peak_rpm | -0.0001 | 0.000 | -0.757 | 0.450 | -0.001 0.000 |
| price | 8.963e-06 | 2.8e-05 | 0.320 | 0.750 | -4.64e-05 6.44e-05 |
| stroke | -0.0668 | 0.268 | -0.249 | 0.803 | -0.597 0.463 |
| wheel_base | -0.2074 | 0.031 | -6.669 | 0.000 | -0.269 -0.146 |
| width | 0.2207 | 0.081 | 2.716 | 0.007 | 0.060 0.381 |
| Omnibus: | 0.983 | Durbin-Watson: | 1.035 |
|---|---|---|---|
| Prob(Omnibus): | 0.612 | Jarque-Bera (JB): | 0.833 |
| Skew: | 0.177 | Prob(JB): | 0.659 |
| Kurtosis: | 3.013 | Cond. No. | 1.22e+06 |
