Pandas 3 TimeSeries, Category
pandas Time Series 다루기, 컬럼을 범주형으로 처리하기
Time Series
시간의 흐름에 따른 데이터를 다룰 수 있는 쉽고, 강력하고, 효율적인 pandas의 기능.
import pandas as pd
import numpy as np
Time Series 생성
# 2016년 10월 1일 0시 0분 기준으로 1초 단위의 500개 데이터로 series 생성
dateRange = pd.date_range('2016/10/1', periods=500, freq='S')
ts = pd.Series(range(len(dateRange)), index=dateRange)   # 0 부터 정수 생성
ts.head()
2016-10-01 00:00:00    0
2016-10-01 00:00:01    1
2016-10-01 00:00:02    2
2016-10-01 00:00:03    3
2016-10-01 00:00:04    4
Freq: S, dtype: int32
ts.tail()
2016-10-01 00:08:15    495
2016-10-01 00:08:16    496
2016-10-01 00:08:17    497
2016-10-01 00:08:18    498
2016-10-01 00:08:19    499
Freq: S, dtype: int32
ts_1min = ts.resample('1Min').sum() # 1초 단위 데이터를 1분 단위 데이터로 만들기
ts.resample('3Min').sum() # 3분 단위 데이터로 만들기
2016-10-01 00:00:00    16110
2016-10-01 00:03:00    48510
2016-10-01 00:06:00    60130
Freq: 3T, dtype: int32
Time Series에서 timezone 다루기
dates = pd.date_range('2016/10/01 00:00', periods=90, freq='D')   # 15일
ts = pd.Series(np.random.randint(0, 100, len(dates)), dates) # 0~99까지 난수
ts.head()
2016-10-01    22
2016-10-02    77
2016-10-03    94
2016-10-04    29
2016-10-05    21
Freq: D, dtype: int32
import matplotlib.pyplot as plt
%matplotlib inline
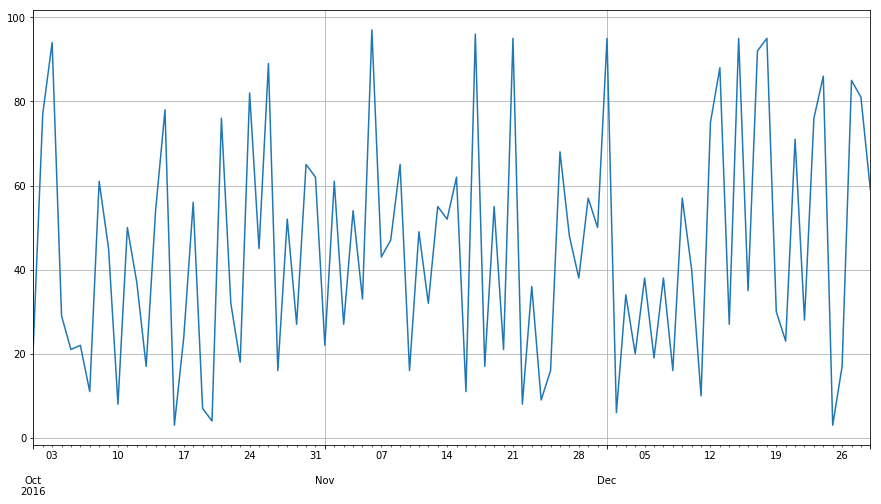
ts.plot(figsize=(15,8), grid=True)
<matplotlib.axes._subplots.AxesSubplot at 0x29d7166f7b8>

ts_utc = ts.tz_localize('UTC')
ts_utc.head()
2016-10-01 00:00:00+00:00    22
2016-10-02 00:00:00+00:00    77
2016-10-03 00:00:00+00:00    94
2016-10-04 00:00:00+00:00    29
2016-10-05 00:00:00+00:00    21
Freq: D, dtype: int32
ts_utc.tz_convert('Asia/Seoul').head() # timezone 변경
2016-10-01 09:00:00+09:00    22
2016-10-02 09:00:00+09:00    77
2016-10-03 09:00:00+09:00    94
2016-10-04 09:00:00+09:00    29
2016-10-05 09:00:00+09:00    21
Freq: D, dtype: int32
월 단위 time series 생성
months = pd.date_range('2016/10/27 00:00', periods=5, freq='M')
ts = pd.Series(range(len(months)), index=months)   # 해당 월의 마지막 날짜로 time series 생성됨
ts
2016-10-31    0
2016-11-30    1
2016-12-31    2
2017-01-31    3
2017-02-28    4
Freq: M, dtype: int32
ps = ts.to_period()   # 월 단위 값으로 변경
ps
2016-10    0
2016-11    1
2016-12    2
2017-01    3
2017-02    4
Freq: M, dtype: int32
ps.to_timestamp() # 해당 월의 1일로 time series 변환
2016-10-01    0
2016-11-01    1
2016-12-01    2
2017-01-01    3
2017-02-01    4
Freq: MS, dtype: int32
분기 단위 time series 생성
prng = pd.period_range('2016Q1', '2017Q4', freq='Q-NOV')
ts = pd.Series(range(len(prng)), index=prng)
ts
2016Q1    0
2016Q2    1
2016Q3    2
2016Q4    3
2017Q1    4
2017Q2    5
2017Q3    6
2017Q4    7
Freq: Q-NOV, dtype: int32
# frequency 타입을 분기에서 날짜+시간 형태로 변경
ts.index = (prng.asfreq('M', 'e') + 1).asfreq('H', 's') + 9
ts
2016-03-01 09:00    0
2016-06-01 09:00    1
2016-09-01 09:00    2
2016-12-01 09:00    3
2017-03-01 09:00    4
2017-06-01 09:00    5
2017-09-01 09:00    6
2017-12-01 09:00    7
Freq: H, dtype: int32
범주형 데이터 Categoricals
df = pd.DataFrame({"id":[1,2,3,4,5,6],
                   "raw_grade":['a', 'b', 'b', 'a', 'a','e']})
df
| id | raw_grade | |
|---|---|---|
| 0 | 1 | a |
| 1 | 2 | b |
| 2 | 3 | b |
| 3 | 4 | a |
| 4 | 5 | a |
| 5 | 6 | e |
df["grade"] = df["raw_grade"].astype("category") # 범주화된 컬럼 추가
df["grade"]
0    a
1    b
2    b
3    a
4    a
5    e
Name: grade, dtype: category
Categories (3, object): [a, b, e]
# 카테고리를 의미있는 이름으로 변경
df["grade"].cat.categories = ["Wonderful", "Good", "Ooops"]
df
| id | raw_grade | grade | |
|---|---|---|---|
| 0 | 1 | a | Wonderful |
| 1 | 2 | b | Good |
| 2 | 3 | b | Good |
| 3 | 4 | a | Wonderful |
| 4 | 5 | a | Wonderful |
| 5 | 6 | e | Ooops |
# 카테고리의 순서를 바꾸고, 동시에 중간에 빠진 카테고리 추가
df["grade"] = df["grade"].cat.set_categories(["Ooops","Bad","Medium","Good","Wonderful"])
df   # 카테고리를 추가해도 처음 설정된 카테고리는 바뀌지 않는다.
| id | raw_grade | grade | |
|---|---|---|---|
| 0 | 1 | a | Wonderful |
| 1 | 2 | b | Good |
| 2 | 3 | b | Good |
| 3 | 4 | a | Wonderful |
| 4 | 5 | a | Wonderful |
| 5 | 6 | e | Ooops |
df.sort_values(by="grade") # 카테고리 순서대로 정렬
| id | raw_grade | grade | |
|---|---|---|---|
| 5 | 6 | e | Ooops |
| 1 | 2 | b | Good |
| 2 | 3 | b | Good |
| 0 | 1 | a | Wonderful |
| 3 | 4 | a | Wonderful |
| 4 | 5 | a | Wonderful |
df.groupby("grade").size() # 각 카테고리 그룹에 속한 원소 갯수 집계
grade
Ooops        1
Bad          0
Medium       0
Good         2
Wonderful    3
dtype: int64
